9 Legends and titles
9.1 Legends
Legends are an essential part of most maps. They provide meaning to the symbols or colors used in the map, and often add information about the map content. They allow to interpret the map correctly, and are therefore crucial for the map readability.
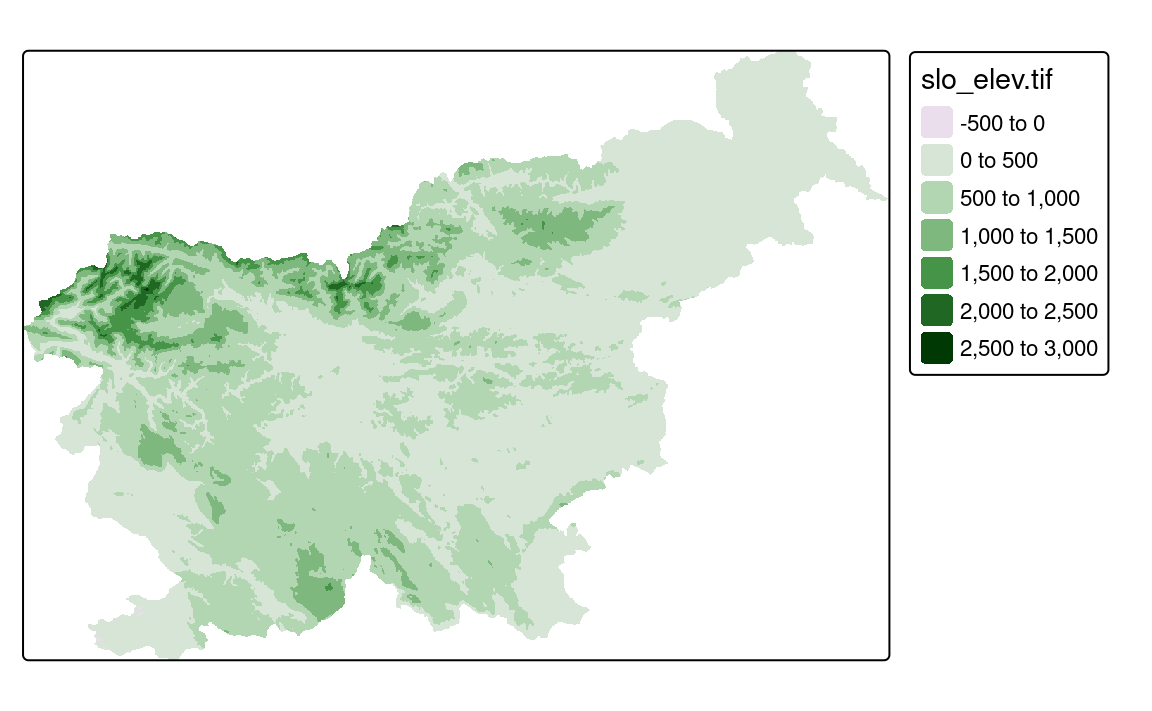
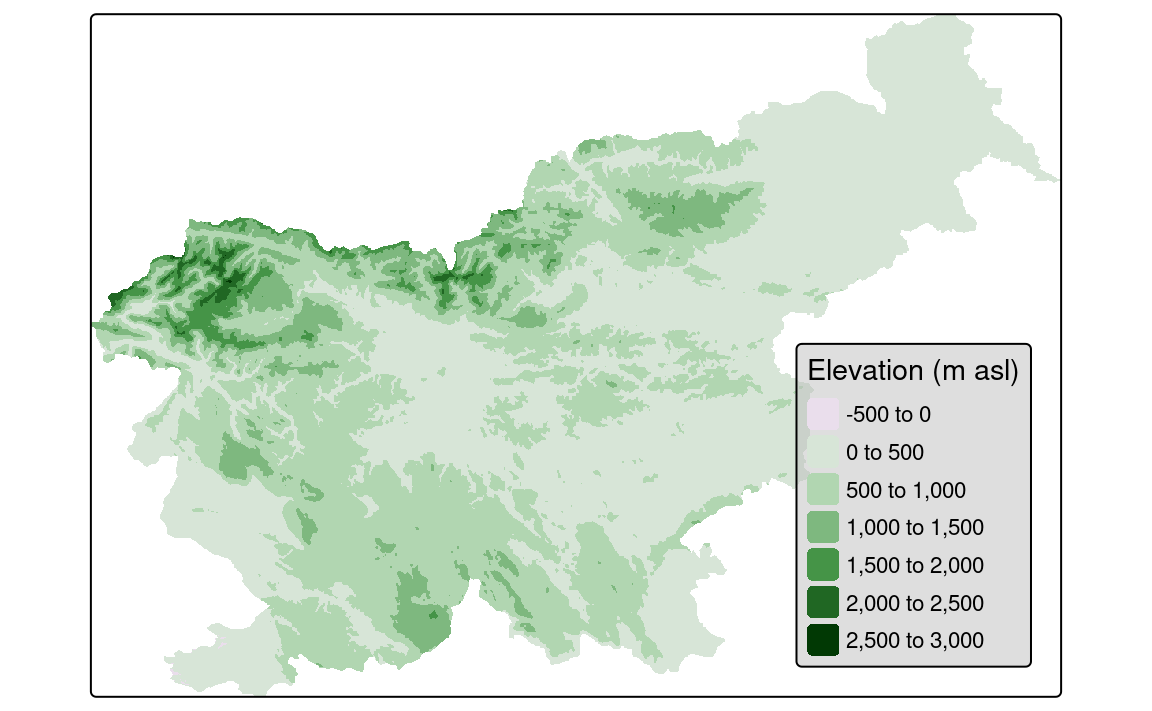
In tmap, legends are created automatically when we add a layer with a data-driven visual variable. By default, such a legend consists of a title based on the variable name and a color/shape/symbol scale (Figure 9.1). It is placed outside of the map frame, either on the right or on the bottom of the map, depending on the automatically determined map aspect ratio.
Such a legend is helpful for quick exploration of the data, but usually, they are not sufficient for sharing the map with others. This chapter covers how to customize the legend’s title, position, and appearance in tmap. Legends are also closely related to the visual variables and scales used in the map that were covered in chapters Chapter 7 and Chapter 8 – we recommend to read those chapters first. Legends are customized using the tm_legend() function that is passed to *.legend arguments of the layer functions, e.g., col.legend, shape.legend, size.legend, etc.
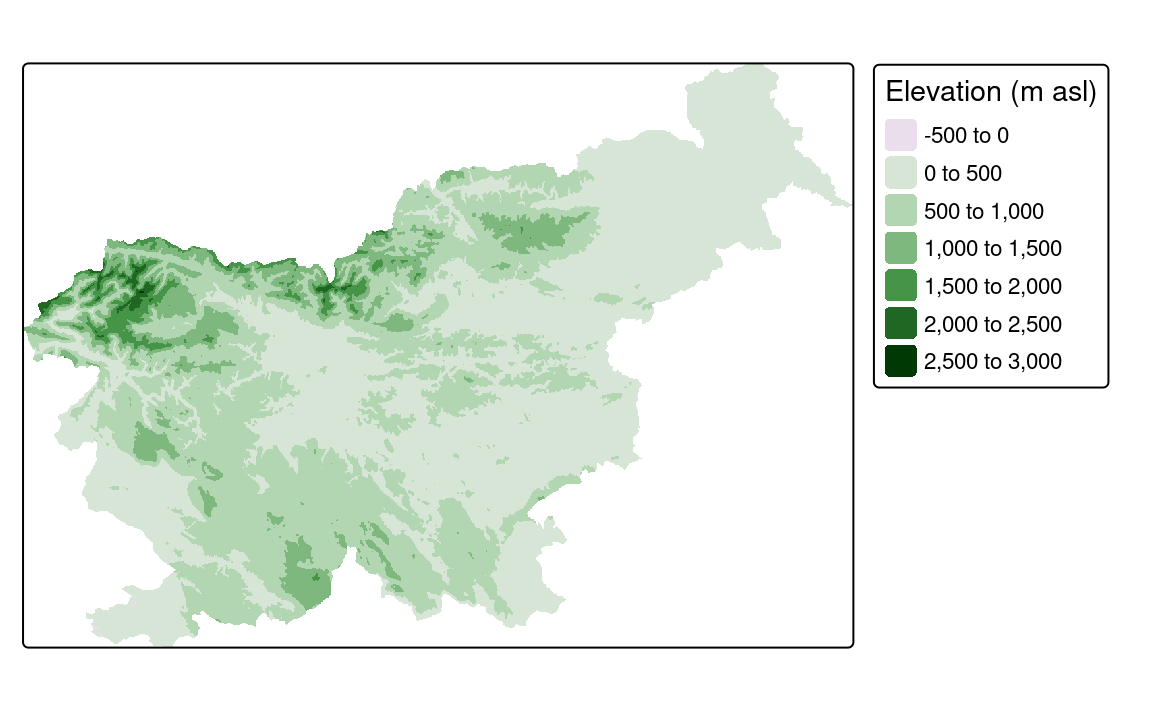
Often, the most important part of the legend is the title. It informs the reader about the meaning of the colors or symbols used in the map, providing also additional context such as the unit of measurement. The title is set using the title argument of the tm_legend() function (Figure 9.2 (a)).
In some cases, the title is not needed, e.g., when the map is self-explanatory, and then this argument can be set to "". Another possibility, when only one legend is used is to remove the legend title, but specify the map variable and its unit in the map title.
The legend title and its text can be customized in many ways, including changing its font size (title.size and text.size), font family (title.family and text.family), and font color (title.color and text.color).
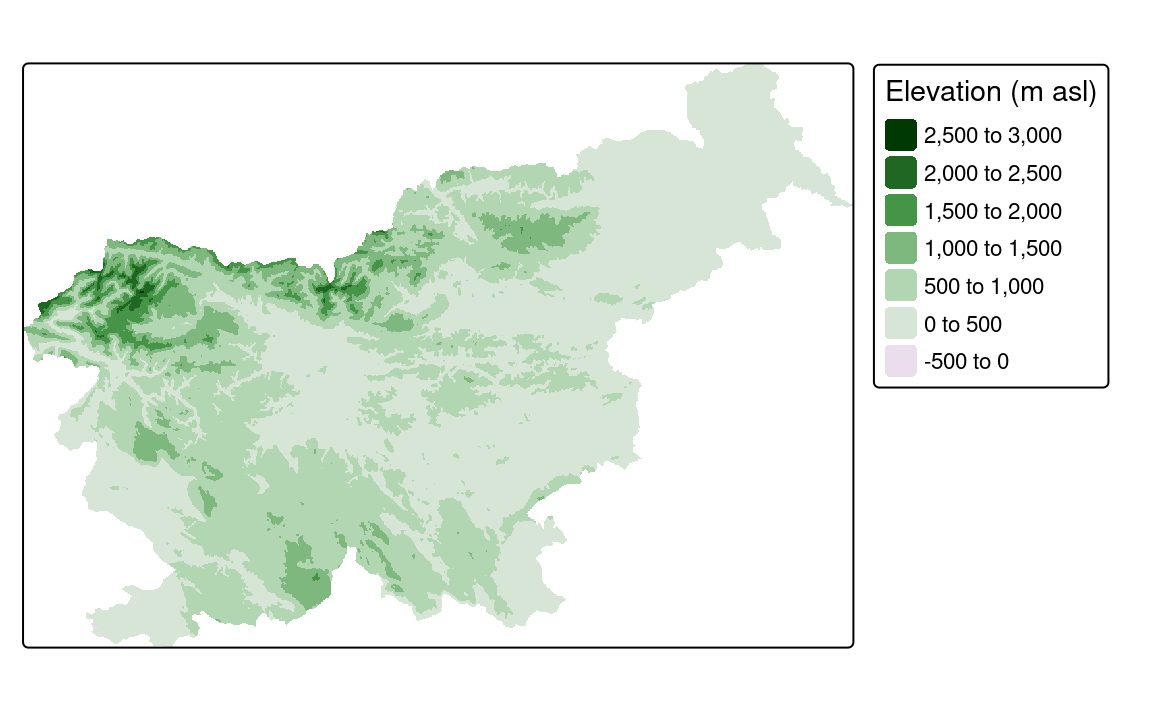
By default, values in the legend are ordered from low to high (i.e., from top to bottom), but this can be reversed using the reverse argument (Figure 9.2 (b)).
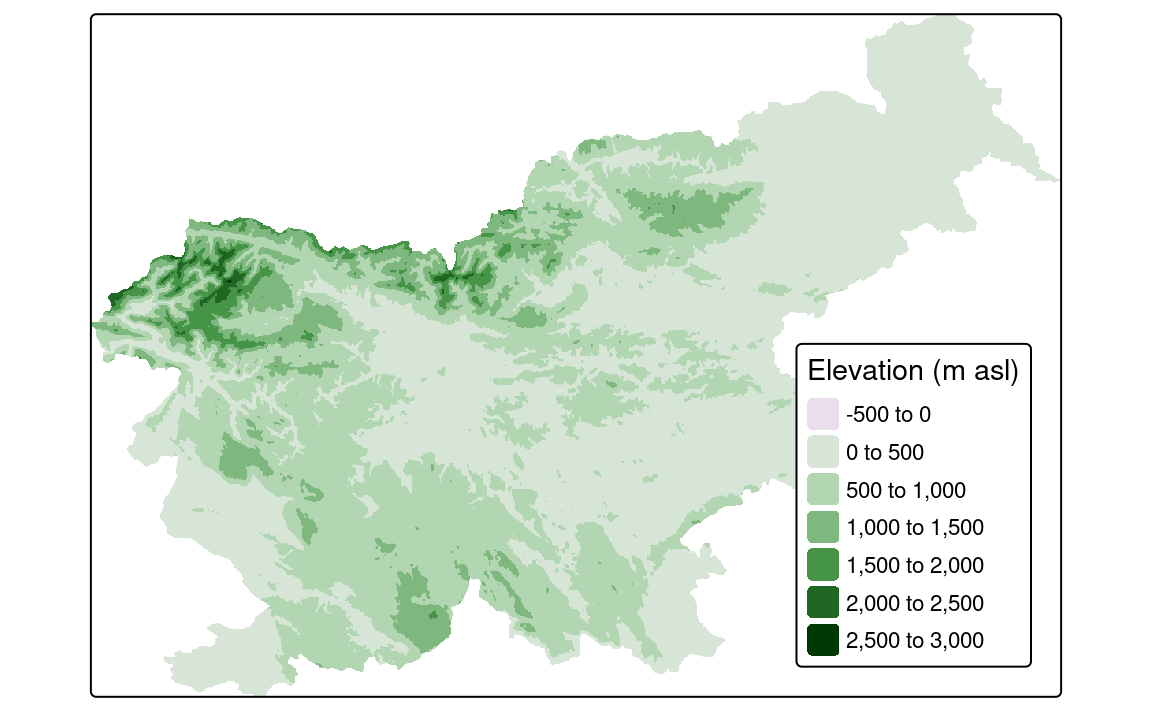
In our example of Slovenia, we have enough white space inside the map frame to place the legend. This can be done with the position argument of the tm_legend() function (Figure 9.2 (c)). To put the legend inside the map frame, we can use the tm_pos_in() function and specify the location of the legend using its first two arguments (Chapter 11).
Depending on the map content, used colors, and expected aesthetic, the legend background can be colored or made transparent. The default legend background is white, but it can be changed using the bg.color argument of the tm_legend() function. In the following example, we set the background color to gray and also make it semi-transparent using the bg.alpha argument (Figure 9.3 (a)).
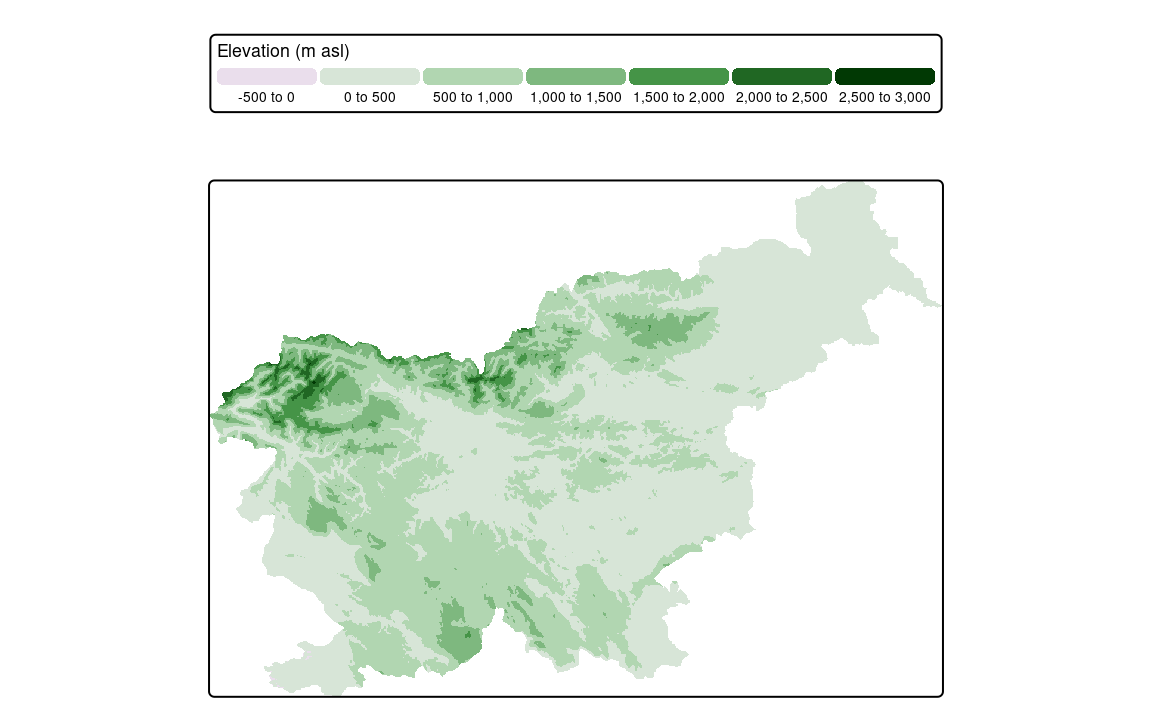
All of the previous examples used the default legend orientation type, "portrait". Its alternative is "landscape", which can be set using the orientation argument of the tm_legend() function. This changes the legend layout to a horizontal orientation, which can be useful either as a mean to better fit to the map content or to change the map aesthetic.
Here, we not only change the legend orientation, but also customize its position with tm_pos_out() (Chapter 11) 1. The three arguments used, "center", "top", and "center" specify the legend position in horizontal and vertical position outside the map frame and then its position relative to that placement (Figure 9.3 (b)).
tm_shape(slo_elev) +
tm_raster(
col.legend = tm_legend(
title = "Elevation (m asl)",
orientation = "landscape",
position = tm_pos_out("center", "top", pos.h = "center")
)
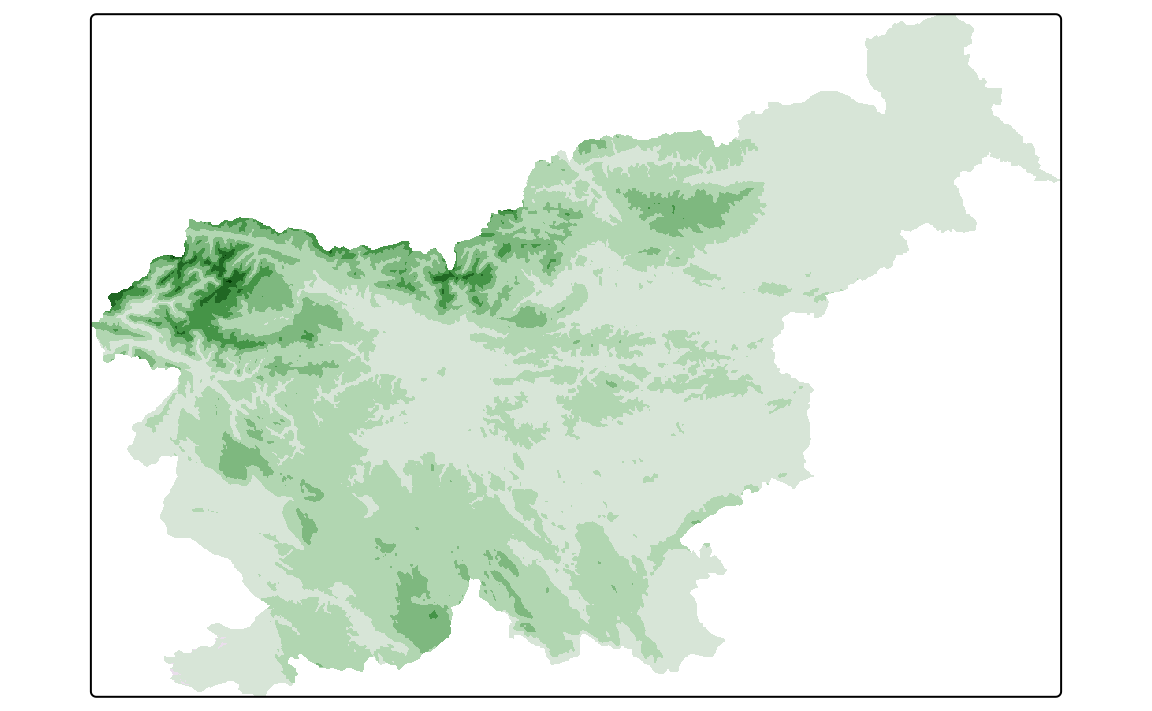
)To disable the legend, we can set the show argument of the tm_legend() function to FALSE (Figure 9.3 (c)). This is useful when we want to use the same legend for multiple layers, or just when we only are interested in the map content and not in the legend – which may be the case when we are using the map for graphical purposes only.
9.2 Titles
By default, the
"landscape"legend is located in the bottom right outside of the map frame↩︎